-1.png?width=1652&height=294&name=Jones(RGB)-1.png "Jones(RGB)-1.png")

Original data provides an authoritative underpinning for the most compelling stories marketers tell. While the story is essential, when it is backed up by research that provides guidelines for solving problems, the combination is twice as strong. So you want to get the most mileage possible from the data and the stories it tells.
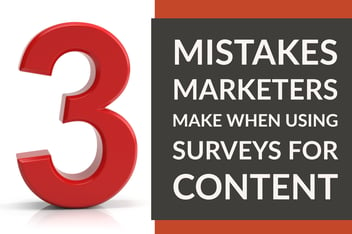
Too often, marketers fall short in their use of surveys, however.
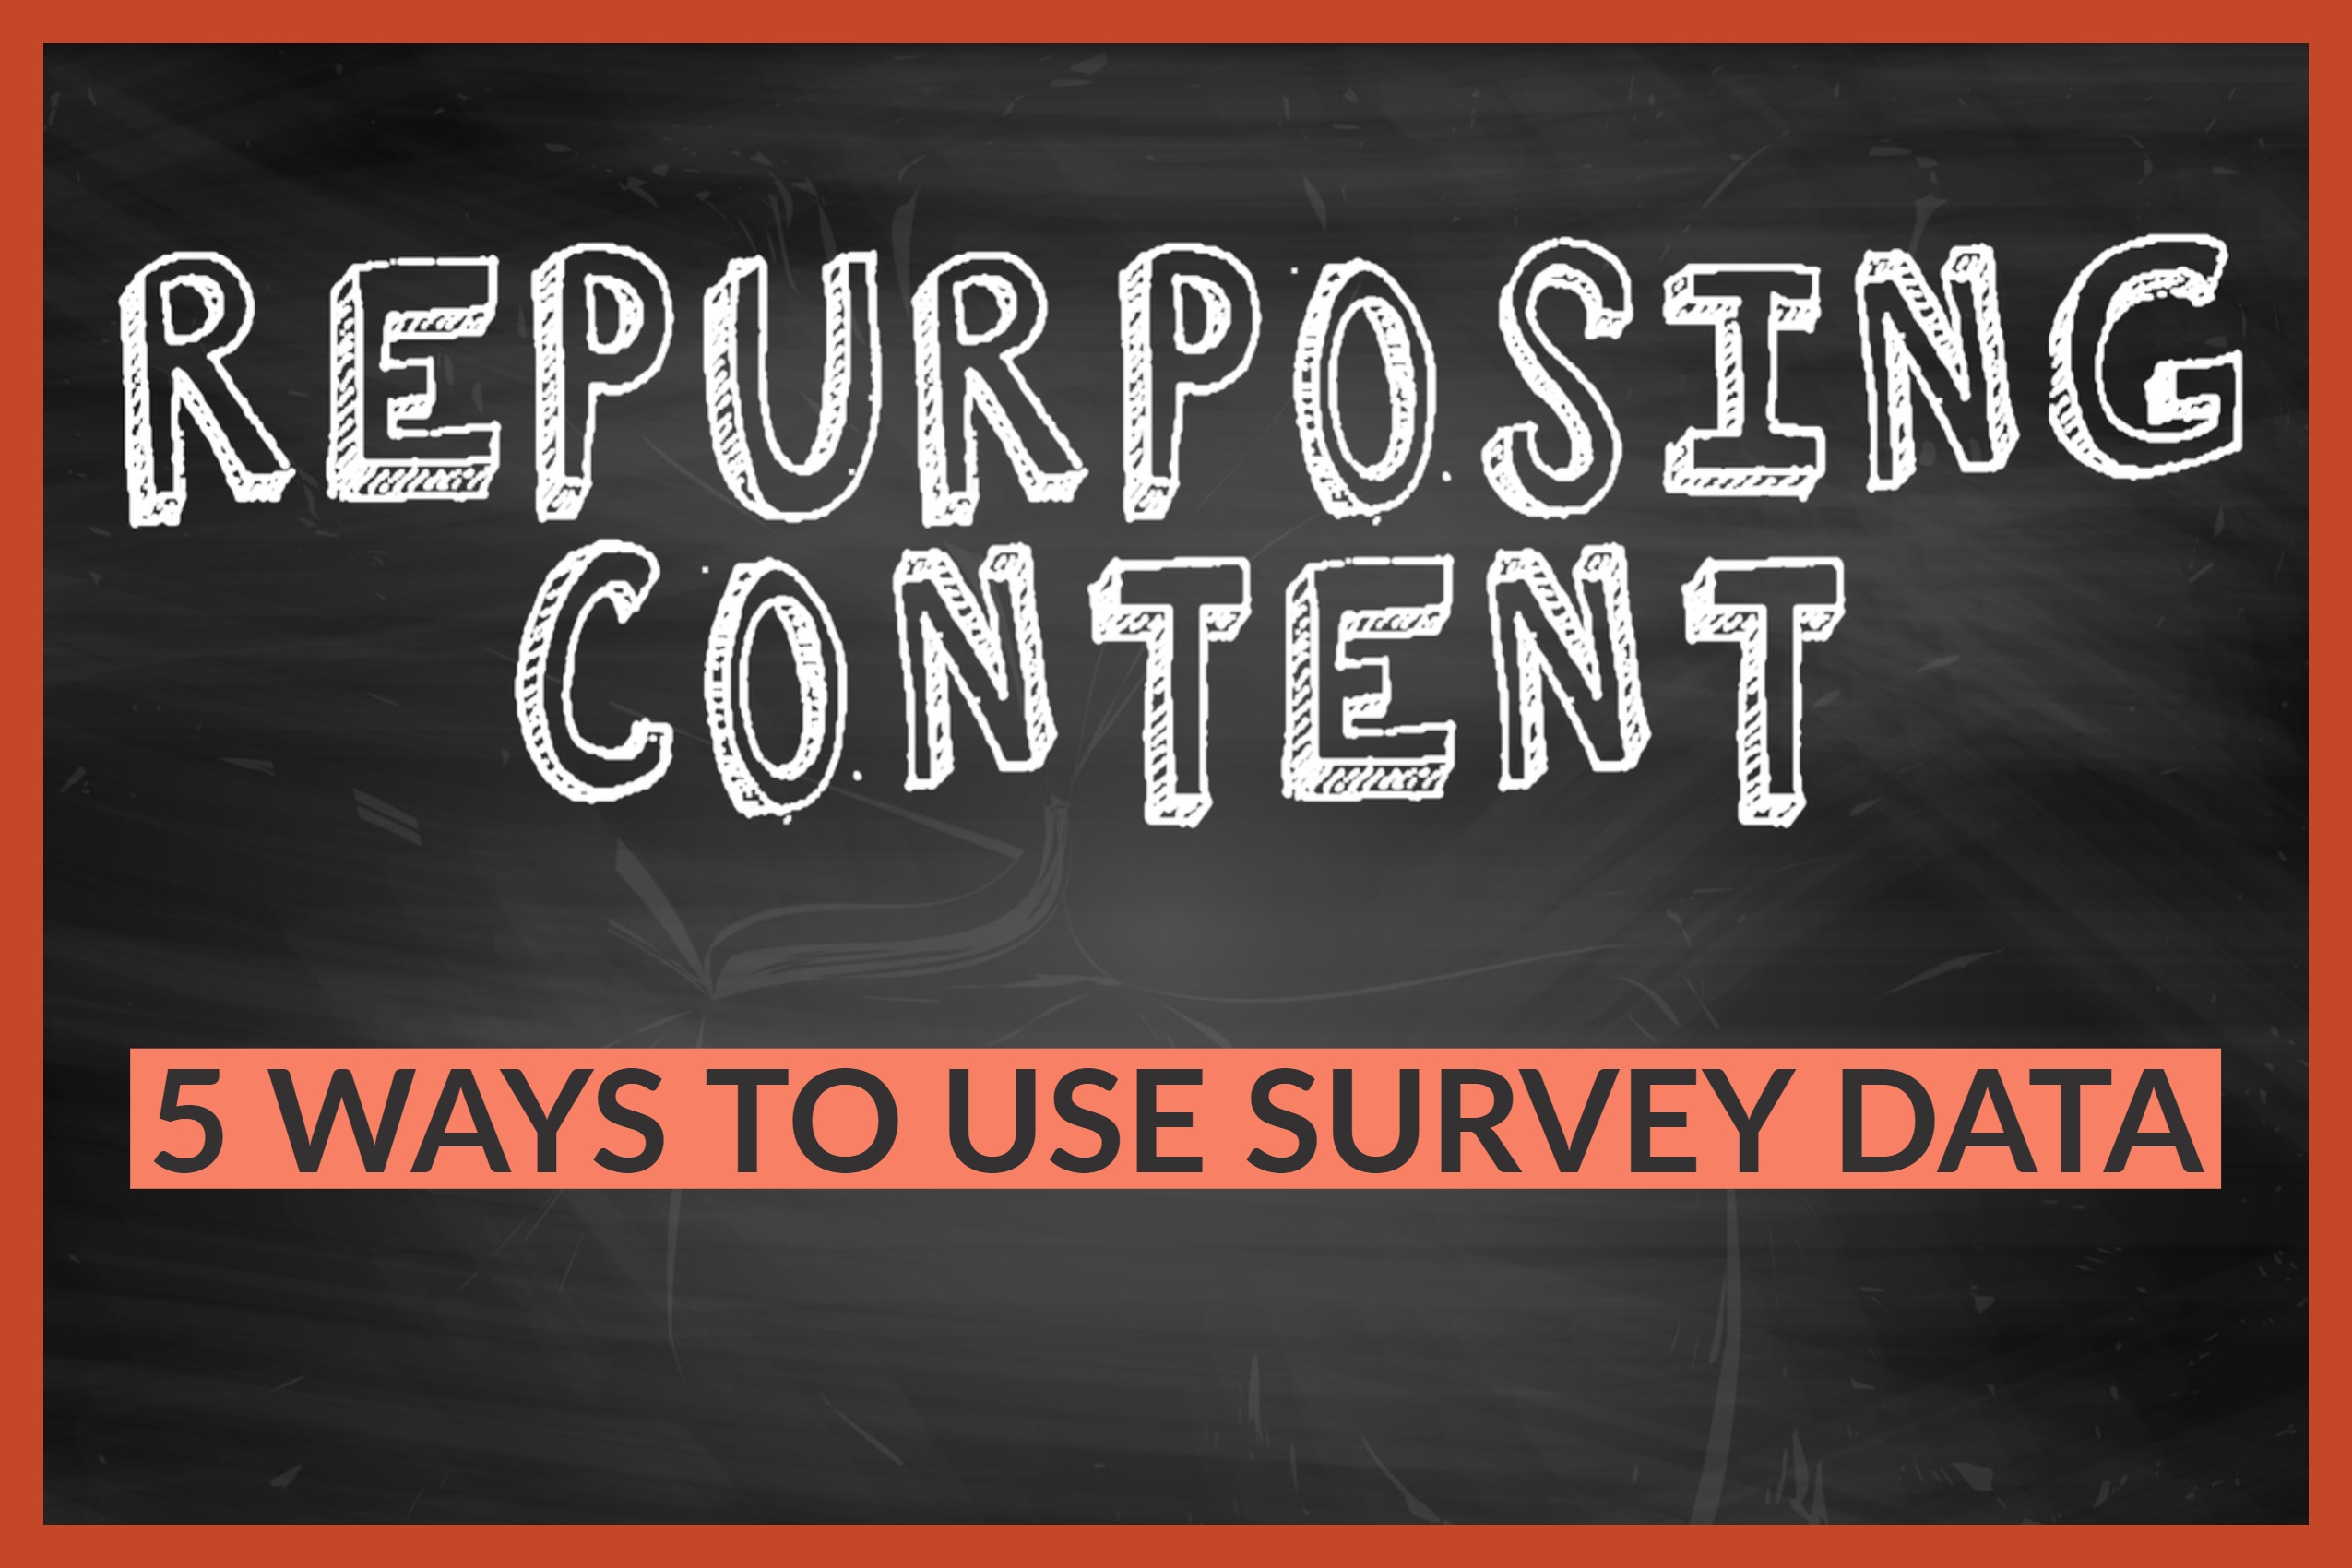
There is no need to limit how you use the information gathered from surveys to a single piece of marketing content. (And actually, the same idea of repurposing material in multiple ways applies to other information as well — we’ve turned the basic ideas in our most popular ebooks into infographics, blog posts and social media posts many times.)
Here is a quick look at how we have helped West Corporation’s Healthcare Division (Televox Solutions) use the same survey data and content topic in five different formats to reach more prospects and customers.
It starts with a survey
One of the best ways to develop compelling marketing content is through carefully crafted surveys that provide data to help your customers do their jobs better. West’s latest campaigns are powered by a pair of surveys — a survey of consumers/patients and a survey of healthcare professionals — designed to gather the information needed for a package of more than a dozen complete content marketing campaigns.
Learn more about creating great surveys that generate usable content in these posts:
Marketing paper covers it all
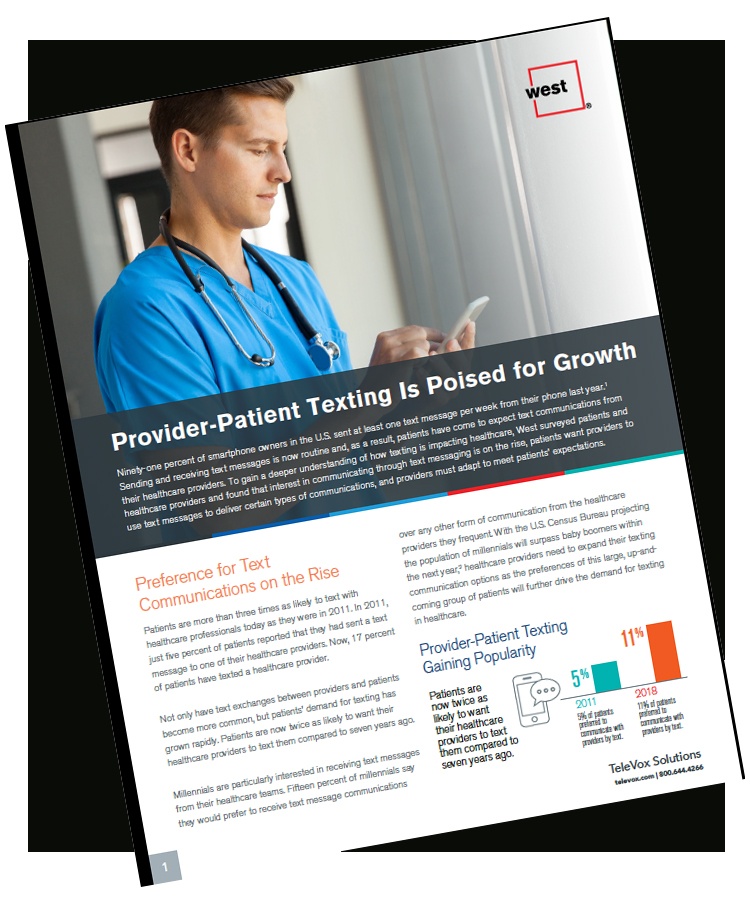
Often the first, and largest, content marketing piece developed from survey data is a whitepaper or report. This could range from a report focused on just a few aspects of the overall survey, such as the four-page paper “Provider-Patient Texting Is Poised For Growth” used by West in their first campaign from the most recent surveys, to something much broader in scope and data like HubSpot’s annual State of Inbound Report (get the 2017 90-page report here).
Blog posts break it into smaller pieces
While the report(s) share data, West has focused the blog posts that are driven by the surveys on providing concrete examples of how its customers can use that data. In this post, which is part of the same campaign as the report above, the company offers up examples of the types of texts patients say they would like to receive. It repurposes that same basic information into a “how-to” format, rather than simple a round-up of statistics. (See the full blog post here: Texting Patients Goes Beyond Appointment Reminders.)
Other blog posts developed as part of the same campaign focus on how texting can improve patient-provider communication and four reasons providers should be texting their patients. Again, these take a slightly different approach than the report in bringing readers useable suggestions for taking action.
Infographics provide visual pop
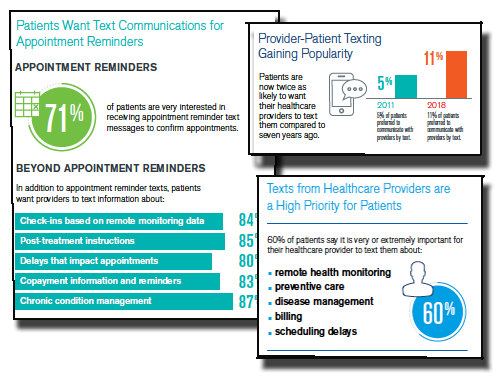
Survey results and other information can also be presented in formats that rely less heavily on text and that may be more shareable by media and the public, alike. JONES and West understand the power of compelling infographics (like this one, which was picked up by USA Today). That is why one component of each campaign package developed from the original surveys is creation of infographics to provide a visual element. The infographics are used in the reports and blog posts, but can also be implemented in video development, social media, public relations and more.
Contributed articles add thought leadership authority
While publishing data on a company’s own website is a great way to build up content and boost search engine optimization, most business decision makers still give greater weight and authority to information and opinions published in industry and business media. This is why it is key for marketing and public relations teams to work together, maximizing how information is used and coordinating the messages being given through both departments.
Contributed articles are a proven method of gaining exposure for your company and its executives (who are cited as authors) as leaders in the industry. These articles should be informative, forward-looking, and NOT sales pieces for your product. (Read more about using contributed bylined articles in How To Get Your CEO Published.)
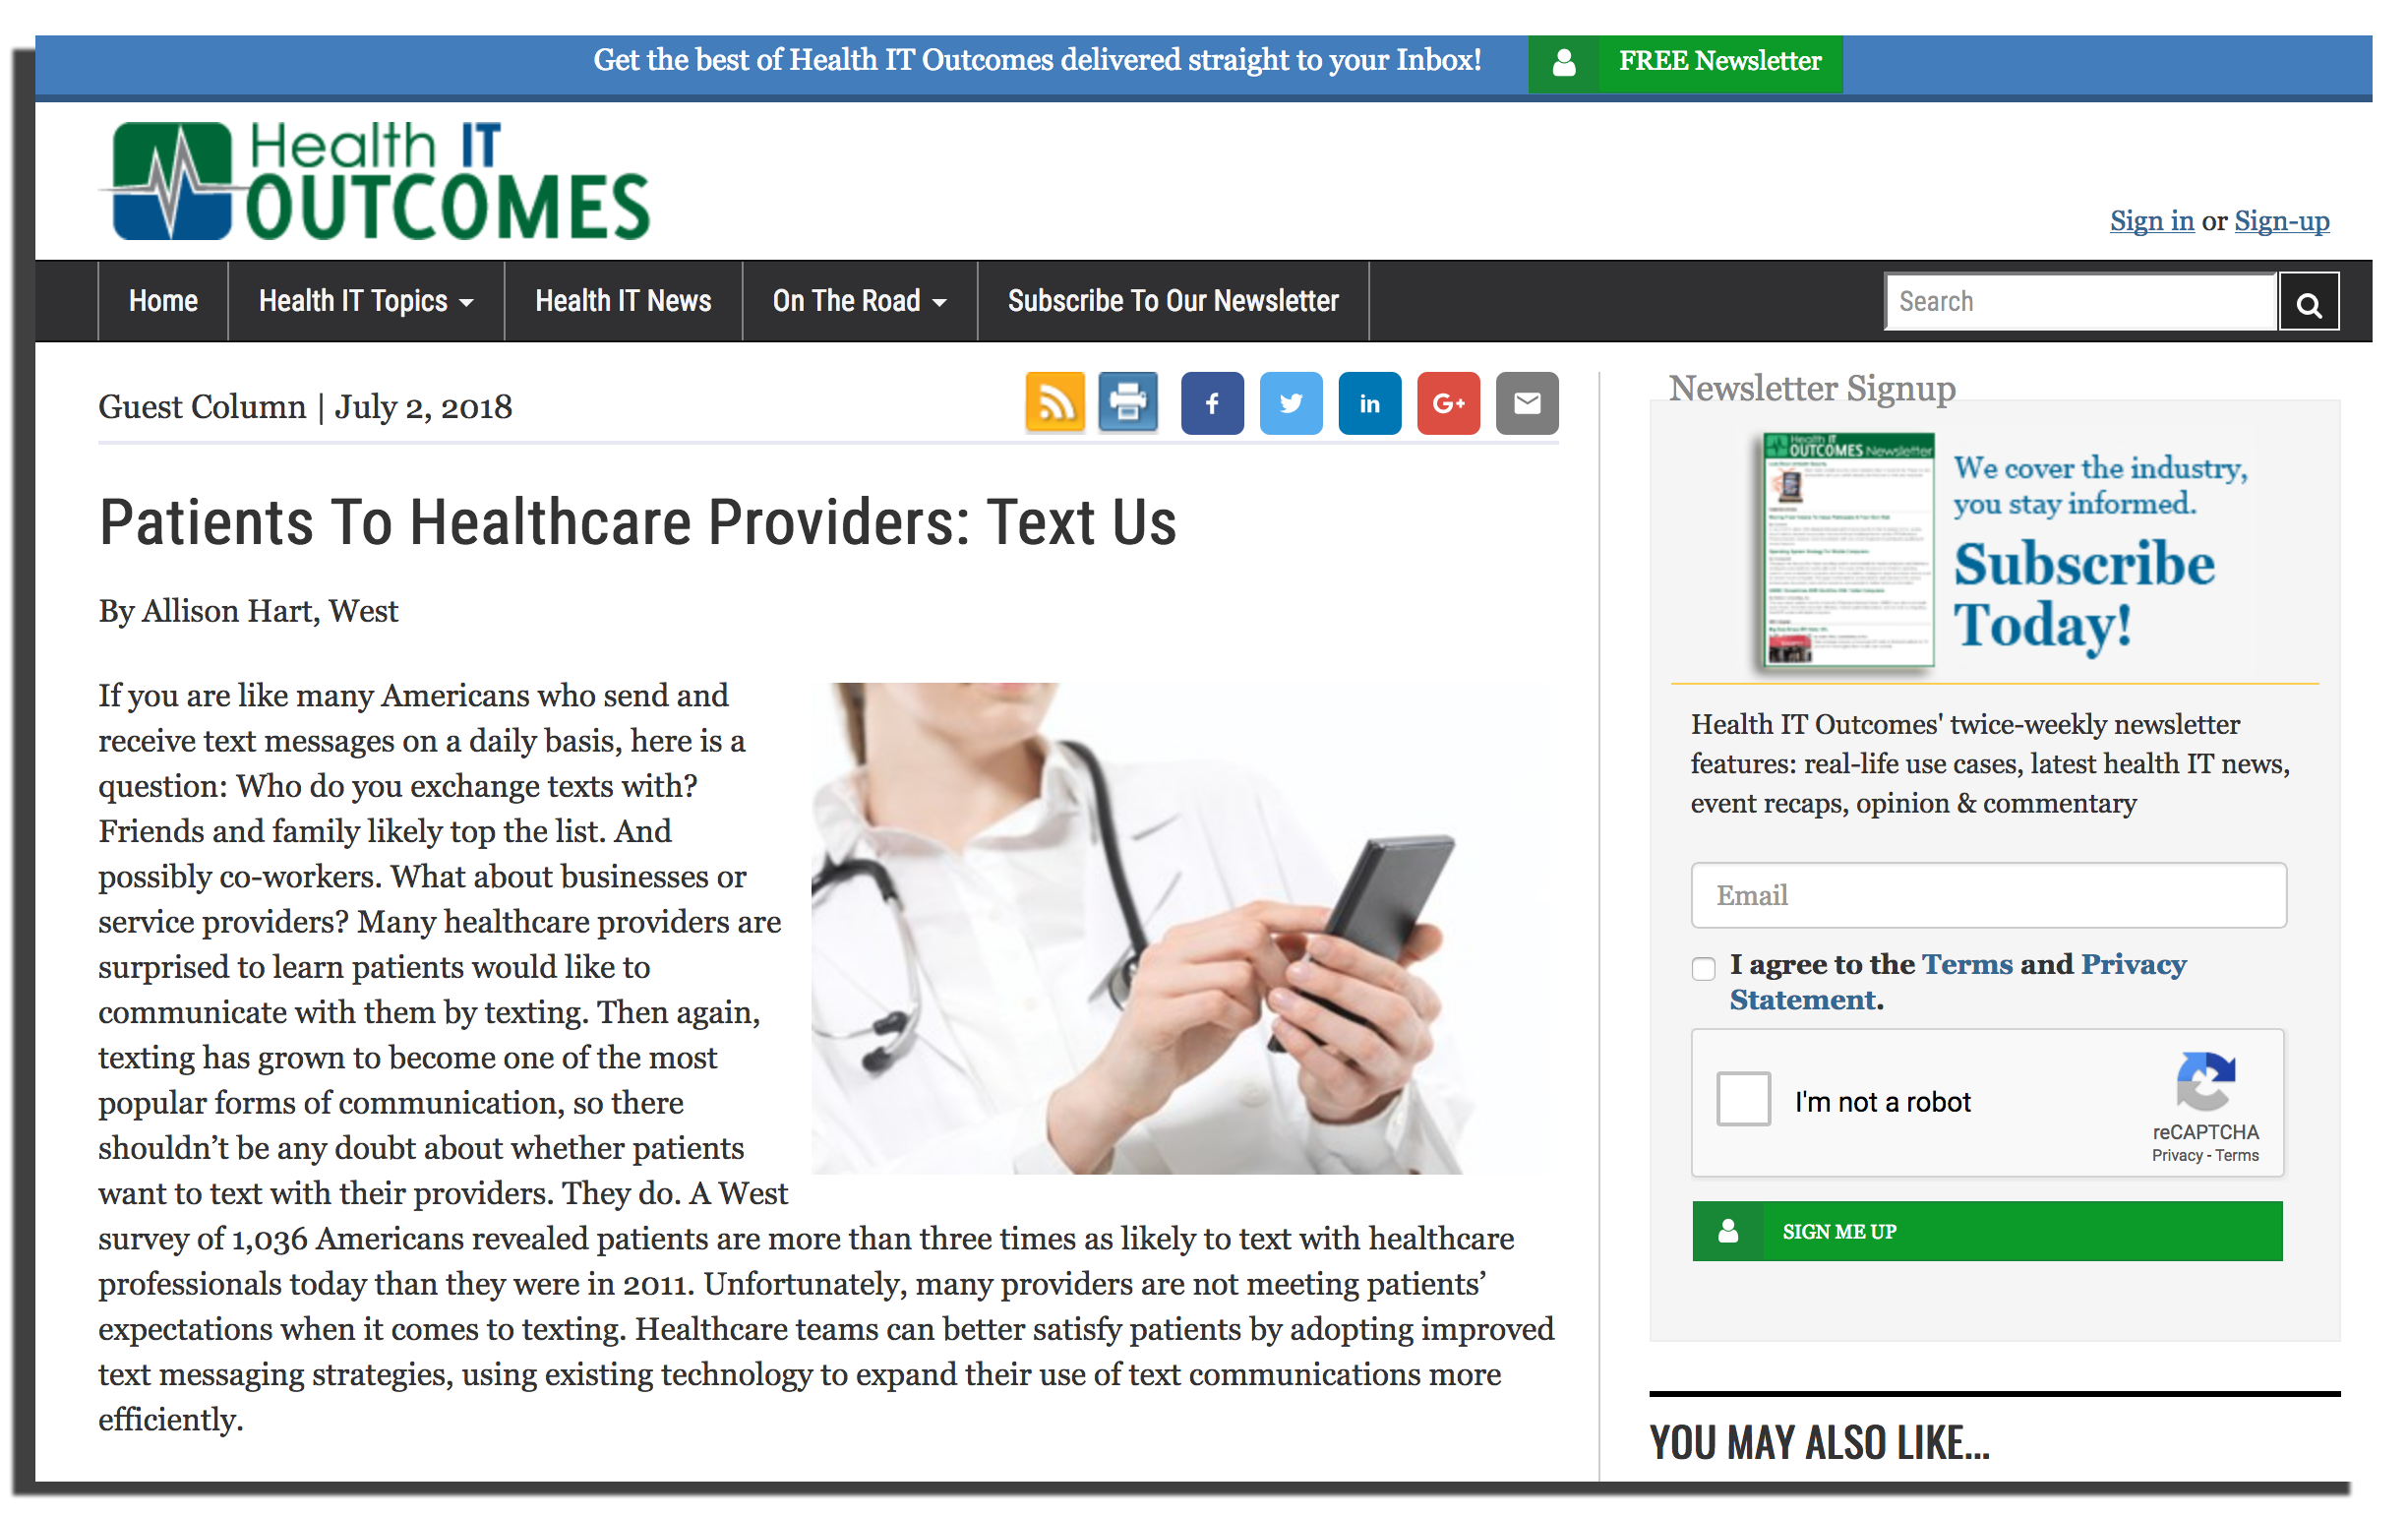
West used the data about patients’ desire to receive text communications from providers in this article, published by Health IT Outcomes. (Patients to Healthcare Providers: Text Us.)
Social media reaches more people
Once you have all of these other pieces of marketing content in place, don’t forget to promote them.
Sharing blog posts, infographics, and successful placements in industry, business or national publications is a great way to gain even more traction for the data and messaging you worked hard to develop through surveys.
I should also point out that this is just one campaign developed from the pair of surveys I mentioned in the beginning. The full survey data will be mined to develop a dozen more campaigns, each encompassing multiple channels just as this one did. That’s smart marketing.
Need even more ideas for how you could use your own survey data? Check out Maximizing Market Surveys, our guide to turning a single survey into more than a thousand individual components for inbound marketing content.