Are You Measuring Your CTA Success? 3 Metrics To Track

Measurement is a key step in any successful marketing program. It is important to know the numbers in order to track performance of your overall marketing strategy, as well the performance of individual elements, so that you can increase the use of elements that work, and improve those elements that aren’t meeting expectations.
Along with metrics such as website traffic, social media followers and reach, and blog post views, you need to track the performance of your calls-to-action, including those that are part of emails, blog posts, website banners, and social media content.
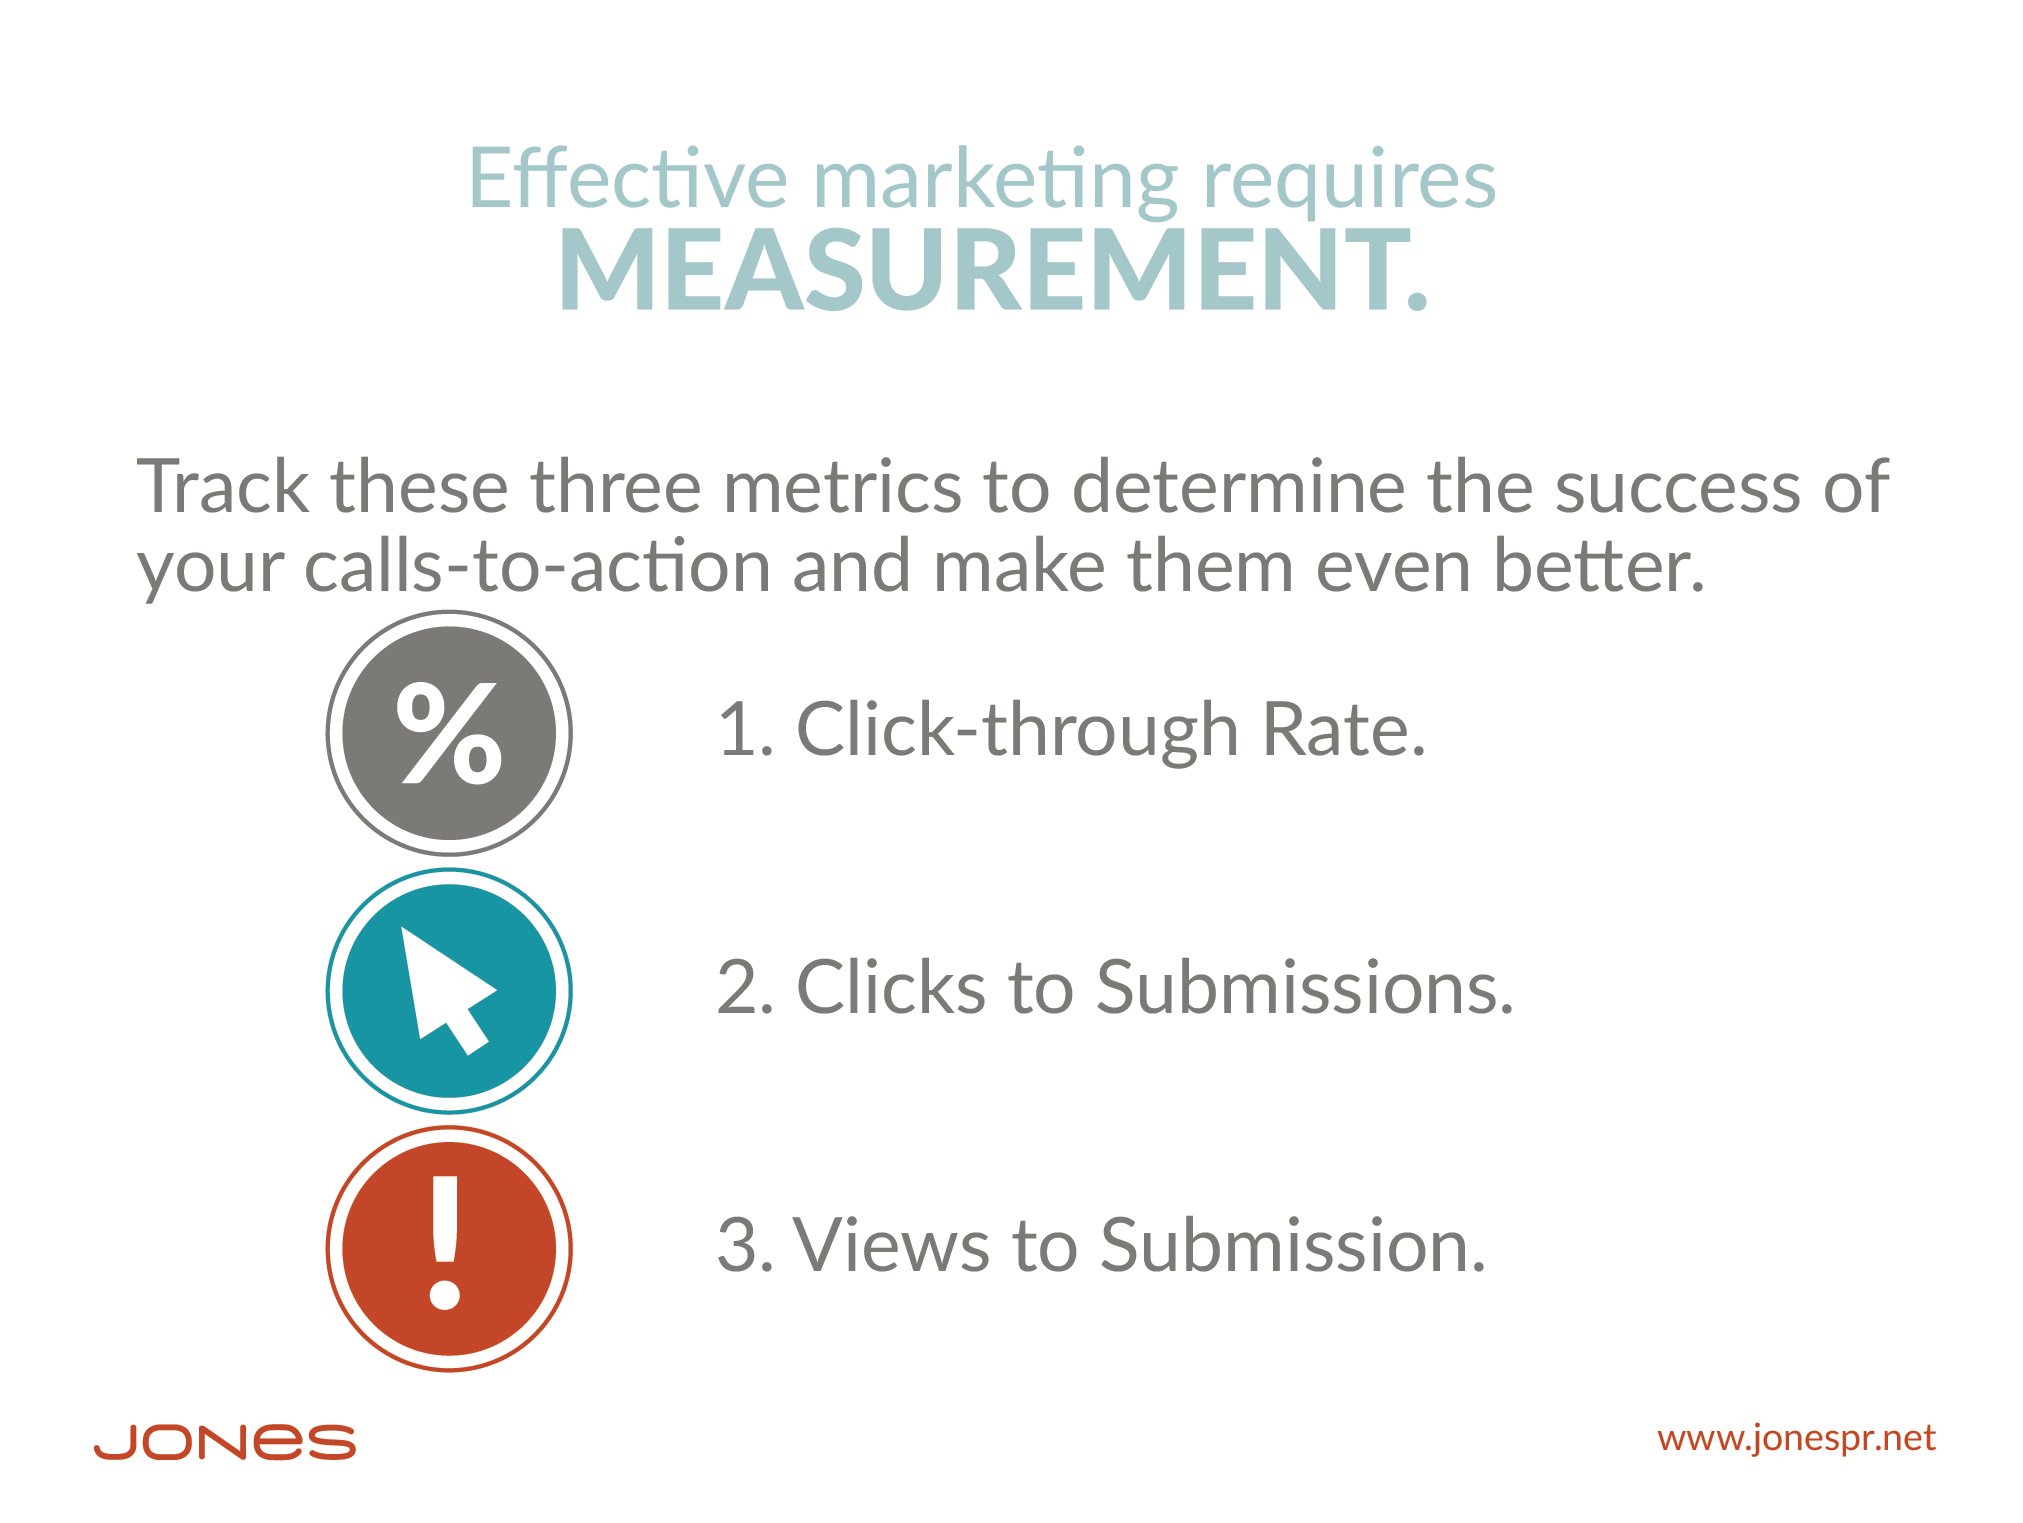
The three key metrics to measure for each CTA are:
1. Click-through rate
2. Clicks to submission
3. Views to submission

Calls-to-action (CTAs) are those little buttons or paragraphs or subtle hyperlinks in text where the magic happens of beginning to turn a visitor or viewer into a lead. It is only when a prospect clicks on a CTA — whether it says “Download!,” “Subscribe!,” or “Get Free Trial!” — that they are taken to a landing page where they can be converted into a lead. (Not sure where to use CTAs – here are 11 places to put them to work.)
But it isn’t enough to just create them, place them and then sit back and relax. In order to get the best results possible as you move from one campaign into another, it is important to measure the success of all elements, including CTAs, and make changes as indicated.
Measuring the success of your CTAs, along with A/B testing different versions of them, will help you improve response rates and increase lead generation. If you aren’t already, start tracking these three metrics:
Click-through rate:
The click-through rate or CTR is a measure of what portion of the people who see your CTA — on your blog, in an email or in social media — click on it. It may be helpful to start by calculating your average CTR for all CTAs on your blog, or in your emails, or on social media. By starting from the average CTR for each channel, you can then begin to compare the results you get for different calls-to-action.
-
Do CTAs for certain offers have a higher CTR across all channels? Then you know that those offers have high appeal, at least initially, and you will want to create more.
-
Do CTAs placed in a certain location on your business blog have higher CTRs? Consider placing those high-valued offers in those locations to double down on lead generation potential.
-
Do calls-to-action that feature a specific topic or a certain type of offer (such as templates vs. ebooks, or coupons vs. free trials) have a higher click-through rate? If so, you may want to focus additional content creation on offers that match these popular topics or offer types.
Clicks to submissions:
Of those who click on the CTA to reach a landing page, how many submit the landing page form and enter your lead nurturing program?
If you have a high CTR rate for certain offers, but few of those clicks actually lead to a submission, you may have problems on the landing page that the CTA takes visitors to. (Check out these 6 Factors That Influence Landing Page Conversion & Bounce Rates.)
Primary suspects for a low click-to-submission rate for calls-to-action that have a high click-through rate include:
The landing page and/or offer don’t match well with the call-to-action: Don’t promise one thing in a CTA, but then provide something different in the actual offer or in the landing page text. It should be obvious that the landing page is going to give the visitor what was offered in the call-to-action.
The landing page form asked for too much information in comparison to the value provided by the offer, or for the typical stage of the buyers’ journey: Landing page forms asking for a lot of personal or business information may turn away prospects, especially those in the early stages of research just encountering your business at an awareness level. A blog subscription should need nothing more than an email address; asking for company name, job title, or other intrusive details doesn’t fit the value of the offer or stage of the sales funnel. You can ask for more information when prospects are downloading materials that fit at the bottom of the sales funnel, such as pricing sheets or product comparisons. (Learn more about using progressive forms to gradually develop lead profiles here: How To Build Customer Profiles With Lead Nurturing.)
Views to submissions:
What percentage of people who see a CTA actually end up converting into a lead?
This is the statistic that follows the prospect from first seeing the CTA — in an email, on your blog, in a social media post, or even in a downloaded whitepaper or report — to clicking on the CTA, completing the landing page form and becoming a lead in your automated lead nurturing program. Exam the views to submission rates of your CTAs from a variety of standpoints:
-
Which channels provide the best views-to-submission? Paid or organic? Email or blog? Facebook or LinkedIn?
-
Which topics have the highest views-to-submission?
-
What format of offer has the highest views-to-submissions? Webinar or whitepaper? Checklist or template? Blog subscription or email newsletter?
Crunch the numbers and spend some time mulling them over, then determine how you can use what you learn about which CTAs, channels, topics and offers yield the best results as your formulate your next inbound marketing campaign.
You’ll find even more tips and guidelines to help you create must-click CTAs in our free ebook: Complete Guide to Designing and Executing Calls-to-Action.


.jpg?width=352&name=Blog%20Metrics%20To%20Measure%20%26%20Use%20(Part%202-%20Lead%20Conversion).jpg)

